Google Analytics 4 (GA4) is a useful service that allows you to measure website performance by many parameters. It is difficult to overestimate the innovativeness of analytics services in search engine promotion, because they make it possible to determine the effectiveness of the chosen strategy. But frequent use of such complex tools requires a lot of effort. Understanding Google Analytics can actually be problematic – the service is very diverse, and at times even frankly bloated. Therefore, in today’s article, we will figure out how to work with Google Analytics.
What is Google Analytics 4?
Google Analytics 4 is a free analytics service that helps study website traffic and the behavior of its visitors. GA4 will also tell you:
- How many people visit the site now and how their number changes over time.
- Where do visitors come from, which traffic sources are more popular.
- Who is the target audience of the resource: how old are they, what gender are they, their location and other parameters.
- From what devices do users visit the site: from a PC or mobile.
- How users behave on the site: which pages are viewed the most, how many conversions do they make, how much time do they spend.
How to connect Google Analytics

Creating and setting up an account
If you don’t have one in Analytics yet, you need to create one on the tool’s website using the “Get started today” button. Then you need to make basic account settings and add the website you plan to track. These steps are fairly simple and shouldn’t cause any difficulties. After the settings, you will receive a tracking code, also known as a tag, which must be installed on all pages of the website. It is the one that collects data and transfers it to the service for further analysis.
Google Tag Manager (GTM)
Let’s take a closer look at tags. GTM is a tag management system that allows you to change and add JavaScript tags and pixels that are used for tracking. It works like this:
- the site owner places a code tag on the pages;
- tags, triggers, variables are configured via Google Tag Manager;
- based on the conditions specified by the user, GTM automatically launches the necessary tags.
Using tags makes GA4 integration and management easier, especially useful for complex assets with multiple events.
You may also find this useful:
Epic New Dashboard: Looker, Which Lets You Analyze Google Analytics + Search Console Data for SEO
Google Analytics 4 Interface
The Analytics interface has 4 tabs: home, reports, explore, advertising. Let’s look at each of them.
Home
The main page of Analytics displays the most important reports: weekly traffic, as well as the number and location of visitors who visited the site in the last half hour.
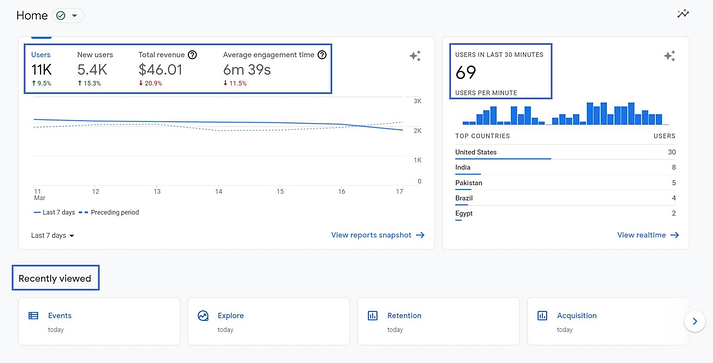
In addition, here you can find information about products, information about active users, sessions broken down by parameters, as well as actions recommended by the service to improve the project.
Reports
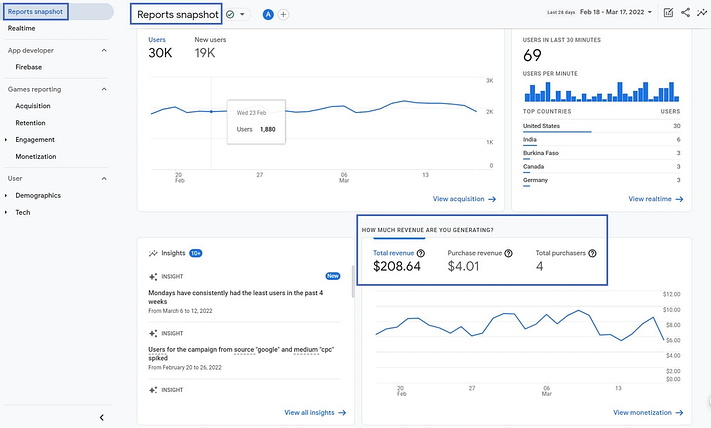
This is the main information base of Analytics, which is the result of the tracking system. All possible information about site visitors, conversions, etc. is collected here.
Explore
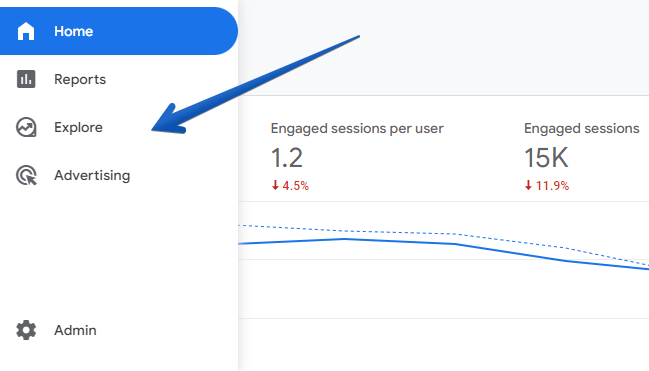
In this section you can create your own reports. There are special templates for this or you can do everything yourself from scratch.
Advertising
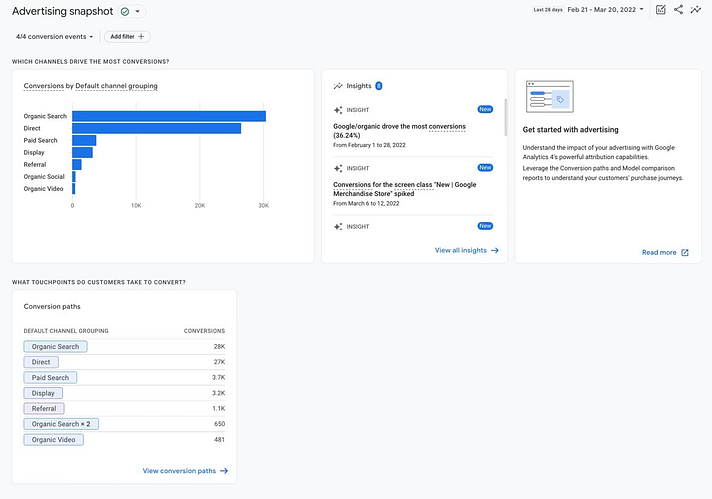
Here you can track the effectiveness of advertising, including Google Ads.
GA4 for SEO – Key Features Overview
Life Cycle
In this section, you can track the entire user path – from the transition to the site to the completion of the target action. That is, how he moves along the sales funnel. Events are of particular importance here, that is, the actions that the user performs when he gets to the site. Analytics independently tracks some events:
- automatically registered – tracked after GA is configured;
- advanced statistics events, if enabled.

There are also recommended and special events that the user can set up.
Event Types
| Traffic sources — audience attraction | Allows you to see where users come to the site from and which traffic acquisition channels are the most effective. |
| User behavior — interaction with the site | You can track how the user behaves on the site, what actions they perform, how deeply they are immersed in viewing, etc. |
| Conversions | Here you can see whether users perform the target action and in what quantities. The amount of profit from conversion is also shown. |
| Retention | Do users return to the site. |
User
The user section allows you to get information about the profile of your audience – age, gender, geography, interests, etc.

There is also segmentation by technology, that is, division by the type of devices, browsers, etc. used by users. The information in the section allows you to better understand who your client is and prepare more relevant content for the target audience.
UTM tags, queries, performance evaluation
To evaluate how successfully your SEO strategy is working, you need to integrate data from Search Console into Analytics. This is done in the resource settings section via the “Related Products” button. There you need to find Search Console and, following the instructions, link the panel to Analytics. After that, the “Requests” block will appear in the reports, where you can track all the necessary information about the search queries that users use to come to your site.

Setting up UTM tags allows you to make Analytics reports even more detailed. You can add several UTM tags to the site URL:
- utm_id — company identifier;
- utm_source — traffic source;
- utm_medium — marketing channel;
- utm_campaign — product, slogan, promo code;
- utm_source_platform — platform that directs traffic to a specific Analytics resource;
- utm_term — paid search query;
- utm_content — to distinguish different creatives;
- utm_creative_format — designation of the creative type.
Results for UTM tags are displayed in traffic source reports.
Recommendations for working with Google Analytics
- Check whether the data is collected correctly, because no matter how reliable the service is, no one is immune to errors. To check the system’s performance, you can use the “Real-Time Report”.
- Goals and conversions should be set up in accordance with the tasks you set for yourself. You do not need to use all the available tools, perhaps you will not need most of them at all. Focus on those that are really useful for your business.
- Try to understand in more detail the segmentation and filtering of data in order to receive statistics only on the necessary parameters and not waste time on unnecessary ones.
Leave a Reply